

3 Minute Read
July 22, 2020
0%
Editor’s note: As we continue to evaluate an ever-changing construction landscape, we’re keeping close tabs on a variety of industry stats and metrics, gathered from both industry reports and our own customer base. On a monthly basis, we’re sharing some of the most interesting and noteworthy highlights with you.
As we monitored our third month of construction activity and metrics, we’re noticing a pattern of leveling off. While business is certainly nowhere near being back to normal, this could indicate that the worst of business disruptions may be over … at least for now. That said, industry reports have noted that construction spending is down, so contractors (and project owners) may be wary of taking on too many new projects without thoroughly vetting them first.
Q2 2020 spending is down 4.8% from Q1 2020. Prior to the Pandemic impact, Q2 was predicted to be up 1% over Q1. So, this is a drop of -5.8% from the initial 2020 forecast.
Comparing 2020 spending to 2019 shows a different story. Q1 2020 is up 9.5% vs Q1 2019. Q2 2020 is up 1.2% vs. Q2 2019.
The BIG question here is, How much of the decline in Q2 was delays, and how much was canceled permanently? There is no good report available that defines the total value of work stoppages and work cancellations. We see some trends that appear the project activity levels are not increasing but holding steady.

Project management activity is determined by looking at actions like accounts payable , purchase orders, progress billing and progress entry events among Viewpoint clients.
In July, we saw a decline in project management, the trend activity in August is holding steady at pre-COVID levels. Also, new project starts are forecasted to drop by about 10% in 2020.
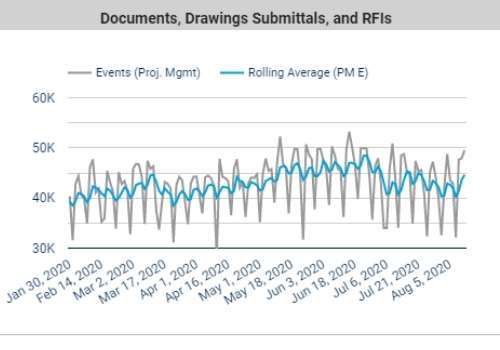
From last month to this month, there was no significant change in activity, meaning there is a flat trend in project activity. "Activity" here is defined by the number of documents, RFIs, drawings and submittals going into our systems. Capturing those activities together gives us a good beat on overall activity. This goes along with the theme that the construction industry forecast is not significantly increasing in the end of the year and managing a steady state of business.

The onboard trend reflects new employee levels having a 12% jump in new employees at the end of July and early August. The forecast indicates that some operations allowed more labor capacity on job sites. This trend did not persist as there is not a significant increase due to the steady state of activity in the industry.
Those are the highlights from this month's activity tracking. But don't wait for us; you can follow the trends for yourself!
Visit the always-on Viewpoint Product Activity Index to get on-demand updates around construction trends.
Posted By
3 Minute Read
July 22, 2020
3 Minute Read
June 25, 2020
Get in touch with us
Request a demo, pricing or information.


We’re not only able to win more jobs, but our jobs are a lot more profitable.
— Aaron Thomas, Accountant, Pieper-Houston Electric L.P.