

3 Minute Read
June 25, 2020
0%

Editor’s note: As we continue to evaluate an ever-changing construction landscape, we’re keeping close tabs on a variety of industry stats and metrics, gathered from both industry reports and our own customer base. On a monthly basis, we’re sharing some of the most interesting and noteworthy highlights with you.
As we share an update on the global economic indicators we’ve been monitoring in July, we noted some interesting findings with construction backlog. While backlog has been stable over the past two months, current readings may be indications of slowing backlogs.
Even though all construction activities have been allowed to continue in most parts of the United States and Canada since the start of the COVID-19 pandemic, many projects in the bidding or final planning stages have been delayed or canceled largely due to the uncertainty surrounding the economy, falling demand for new construction works, and concerns related to COVID-19 safety measures at construction sites.
Especially in the United States, the short-term outlook for North America’s construction industry remains highly uncertain and will depend to a large extent on how long the social distancing measures both voluntary and compulsory prevails in the second half of 2020 and in 2021
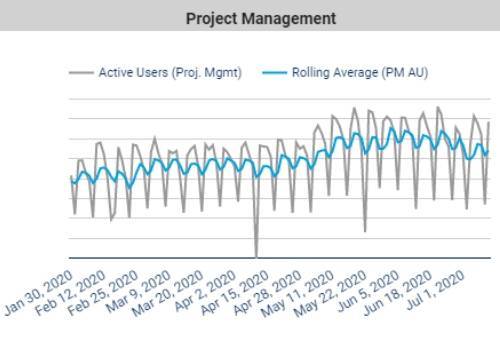
Project management users, project management activity looks at actions like AP, purchase orders, progress billing and progress entry events among Viewpoint clients
The trend in project management activity is slowing down in activity. There has been a 4.1% decrease since last month. It appears that after the world opened back up the current projects were actively finished and now towards the end of June early July there are fewer new projects starting.

From last month to this month there was a 20% downward trend in project activity. "Activity," is defined by the number of documents, RFIs, drawings and submittals going into our systems. Capturing those activities together gives us a good beat on overall activity. This goes along with the theme that the construction backlog and new projects are of concern.
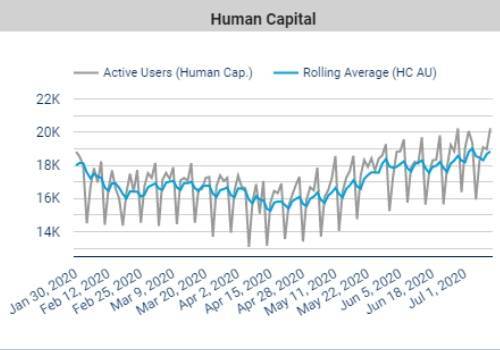
The workforce is back to the pre-COVID-19 levels but is not continuing to rise. This is also an indication that the project backlogs are not as significant.

The onboard trend reflects new employee levels significantly decreasing starting in March and these levels have not bounced back as of July 2020.
Those are the highlights from this month's activity tracking. But don't wait for us; you can follow the trends for yourself!
Visit the always-on Viewpoint Product Activity Index to get on-demand updates around construction trends.
Posted By
3 Minute Read
June 25, 2020
5 Minute Read
October 10, 2019
4 Minute Read
July 1, 2020
Get in touch with us
Request a demo, pricing or information.


We’re not only able to win more jobs, but our jobs are a lot more profitable.
— Aaron Thomas, Accountant, Pieper-Houston Electric L.P.