


3 Minute Read
November 16, 2020
0%

Editor’s Note: Welcome to our new blog series where we capture the very latest trends and metrics in the construction industry and share our takeaways with you. From how to gather data, monitor trends and set benchmarks to what industry data is showing and what it means, this is your one-stop shop to stay ahead of the trends and ahead of the curve with your business and discover insightful insights.
You’ll find the most recent posts and updates at the top, but be sure to scroll down for more great information and discussions.
We started following a new metric among our client base — specialty subcontractor average margin by state.
For North America, this is an aggregated average of projects margin. Things to consider when looking at the various margins is certain states have higher material or labor costs which affects the margins. This information can be useful when bidding to give an indication of typical margins in an area.
As you’ll see in the video below, it’s interesting to compare margins for specialty contractors by state to get a sense of regional differences.
We are also following some interesting trends on labor, equipment and material (LEM) margins across different verticals.
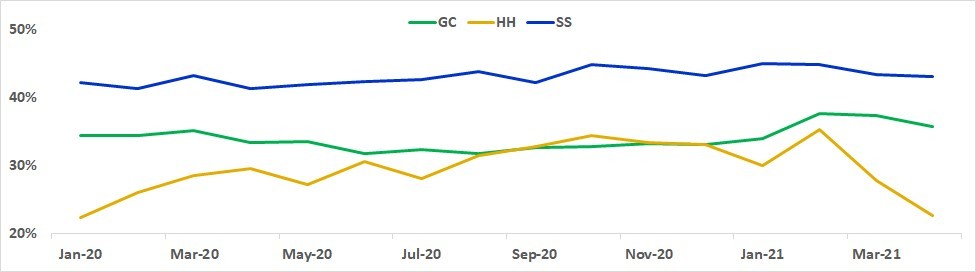
The chart below shows margins based on labor, equipment and material cost for a job. Margins have been very steady for general contractors (GC) and specialty subcontractors (SS). The heavy highway vertical has been increasing since January 2020 with more volatility in 2021.
Average LEM Margins (2020 vs. 2021 ytd) increased, except Heavy Highway
The cost of building has also been a significant issue for contractors in recent months. Evolution of cost distribution and project direct margin impact:
Significant trade material price volatility
Increasing civil labor costs
Material cost spike for building construction as well
What we’re seeing is that prices are continuing to drop from the sky-high levels reached this spring. Material spikes in February and March and starting to normalize. Continuous increases in labor prices, however, are still in play and it remains to be seen if these figures will go back down or continue to increase because of the ongoing skilled labor shortage.

The past two years have taught us that no business is 100% resilient, but if you are better equipped to understand what happened in the past, predict what will happen in the future, and take action in real time, you will have a competitive edge that’s hard to beat. Here’s a preview of our new series, “Know Your Data, Know Your Future: Metrics Construction Leaders Need to Track:”
An Easy Place to Start: Backlogs
One of the key metrics contractors should be measuring is the size of their construction backlog. It is a good overall indicator of the financial health of the company and its projects, and it’s one of the easiest to compare against industry benchmarks.
As you track this data, you might start to see some recurring trends — for example, bigger project backlogs in January and the summer months as more jobs are awarded. Watch how we track backlog trends and learn some of the things to be thinking about with analyzing your data:
The Importance of Monthly Contract Value
Another trend construction leaders should be tracking is overall monthly contract values. This is another indicator of how well your company is doing financially and it’s important to understand what your risk tolerance should be when going after jobs and bidding.
Where you’ll get the most insight out of this metric is by comparing your contract values to the project data we just talked about in the previous video. Ask yourself if you are taking the right size jobs. For example, if your contract value is going down but your backlog looks healthy, your jobs are too small or you might be bidding too low. Here’s more on how to approach this data:
Check back with this blog often, as we'll bring you regular updates and insights into the metrics and trends we're following.
Posted By
3 Minute Read
November 16, 2020
2 Minute Read
October 20, 2020
3 Minute Read
August 17, 2020
Get in touch with us
Request a demo, pricing or information.


We’re not only able to win more jobs, but our jobs are a lot more profitable.
— Aaron Thomas, Accountant, Pieper-Houston Electric L.P.